Once you've created your experiment, you can assign metrics to let you evaluate your experiment's impact and determine if the observed results are statistically significant.
Metric types
There are two types of experiment metrics:
Funnels: Evaluates using funnel conversions. Read more about how we calculate these in our funnel statistic or funnel insights docs.
Trends: Evaluates using aggregate metrics such as total count, average count per user, unique sessions, property values, and more. Trends also let you set the exposure event if you want it to be something other than
$feature_flag_called. Read more about how we calculate these in our trend count or trend continuous statistic or trend insights docs.
Primary and secondary metrics
Each metric can be set as either a primary or secondary metric. You can set up to 10 primary and secondary metrics per experiment.
Primary metrics represent the main goal of your experiment. They directly measure if your hypothesis was successful and are the key factor in deciding if the test achieved its primary objective.
Secondary metrics provide more context for your experiment. They can help you understand the impact of your primary metric and ensure your experiment didn't have negative side effects.
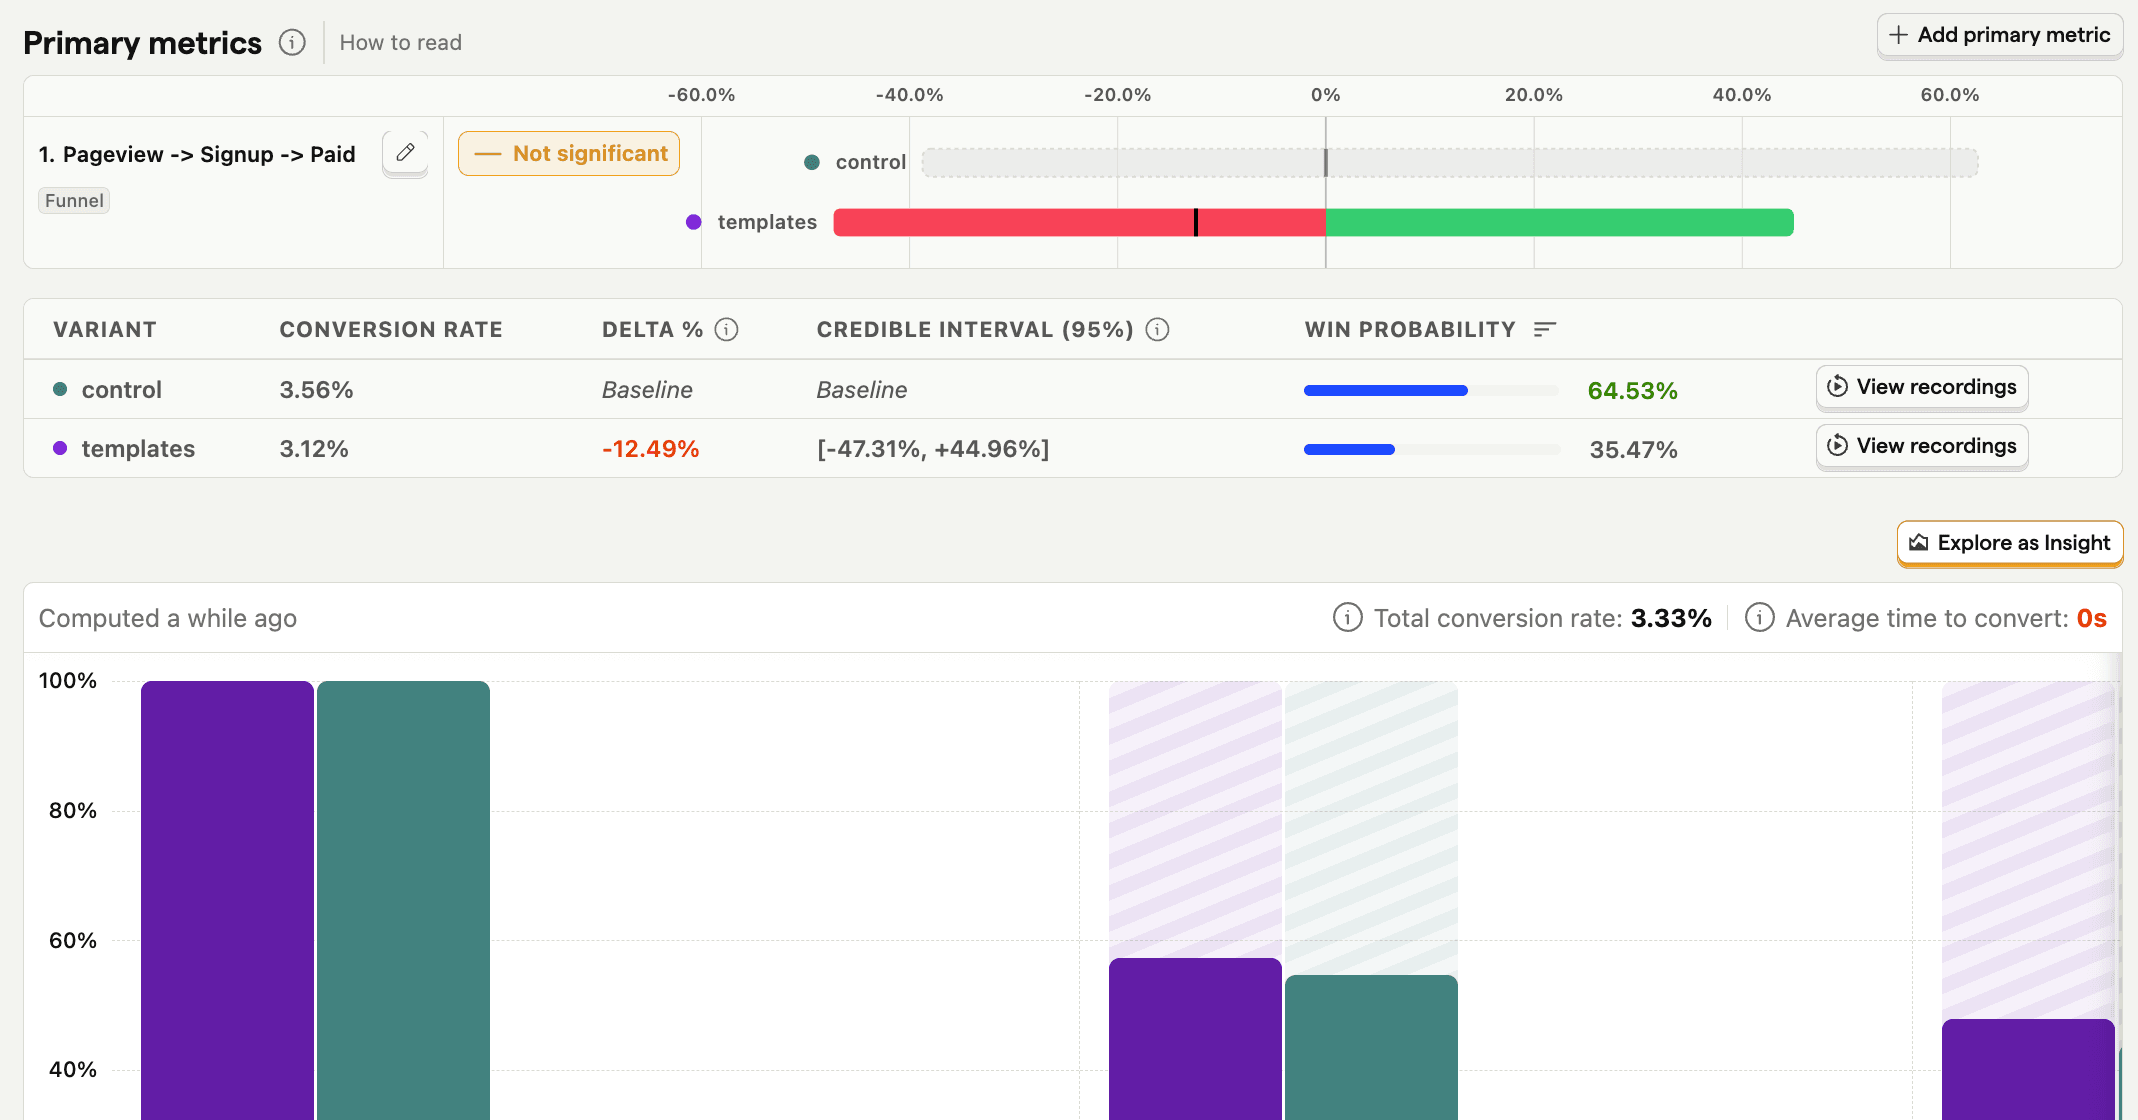
Once added and data starts being collected, we show the results as a credible interval bar chart along with details about significance, win probability, and delta between variants.
How to read credible interval bar charts
Each bar shows how a variant is performing compared to the control (the gray bar) for the metric, using a 95% credible interval. That means there's a 95% chance the true difference for that variant falls within this range. The vertical "0%" line is your baseline:
- To the right (green): The metric is higher (an improvement).
- To the left (red): The metric is lower (a decrease).


The width of the bar represents uncertainty. A narrower bar means we're more confident in that result, while a wider bar means it could shift either way.
The control (baseline) is always shown in gray. Other bars will be green or red—or even a mix—depending on whether the change is positive or negative.
Shared metrics
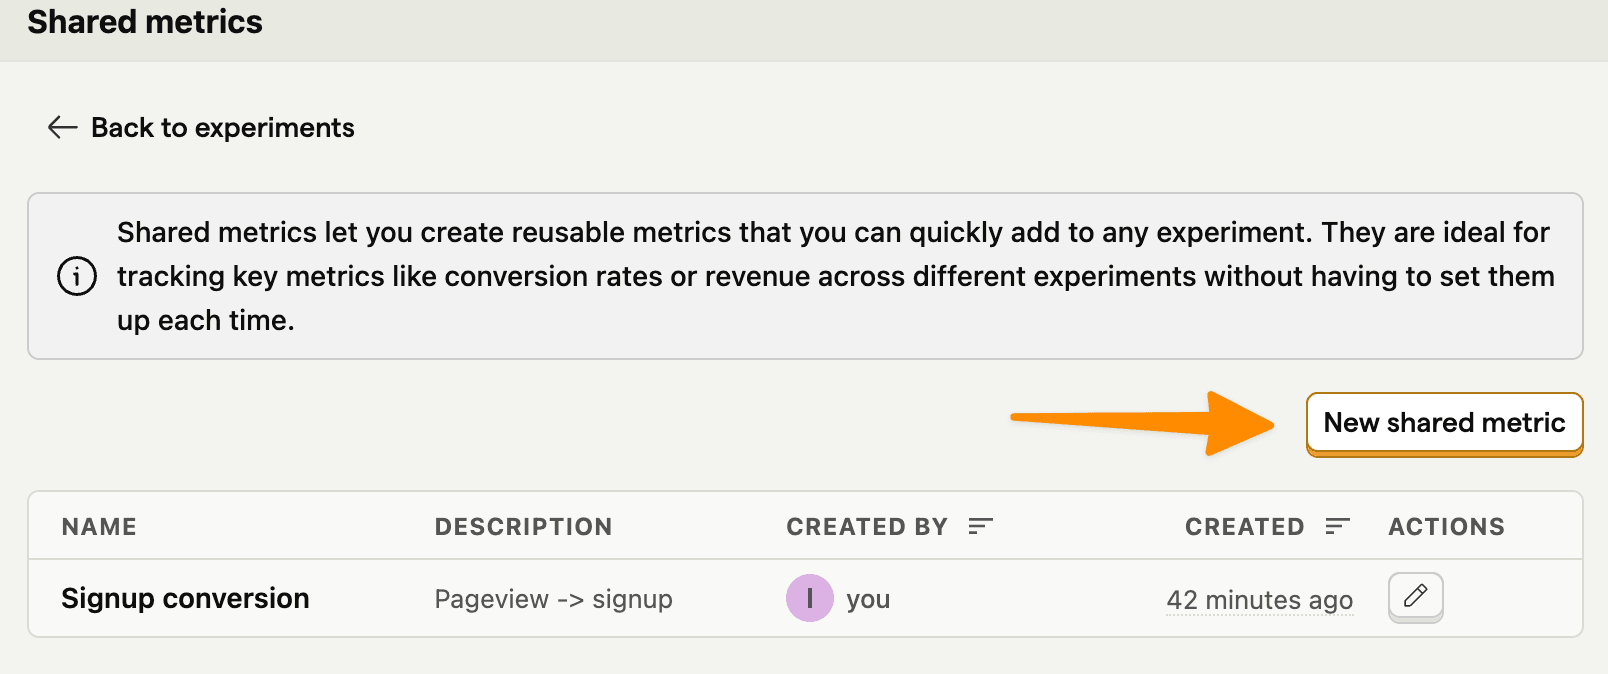
Create a shared metric to easily reuse a funnel or a trend metric across experiments. This is ideal for key company metrics like conversion, revenue, churn, and more.
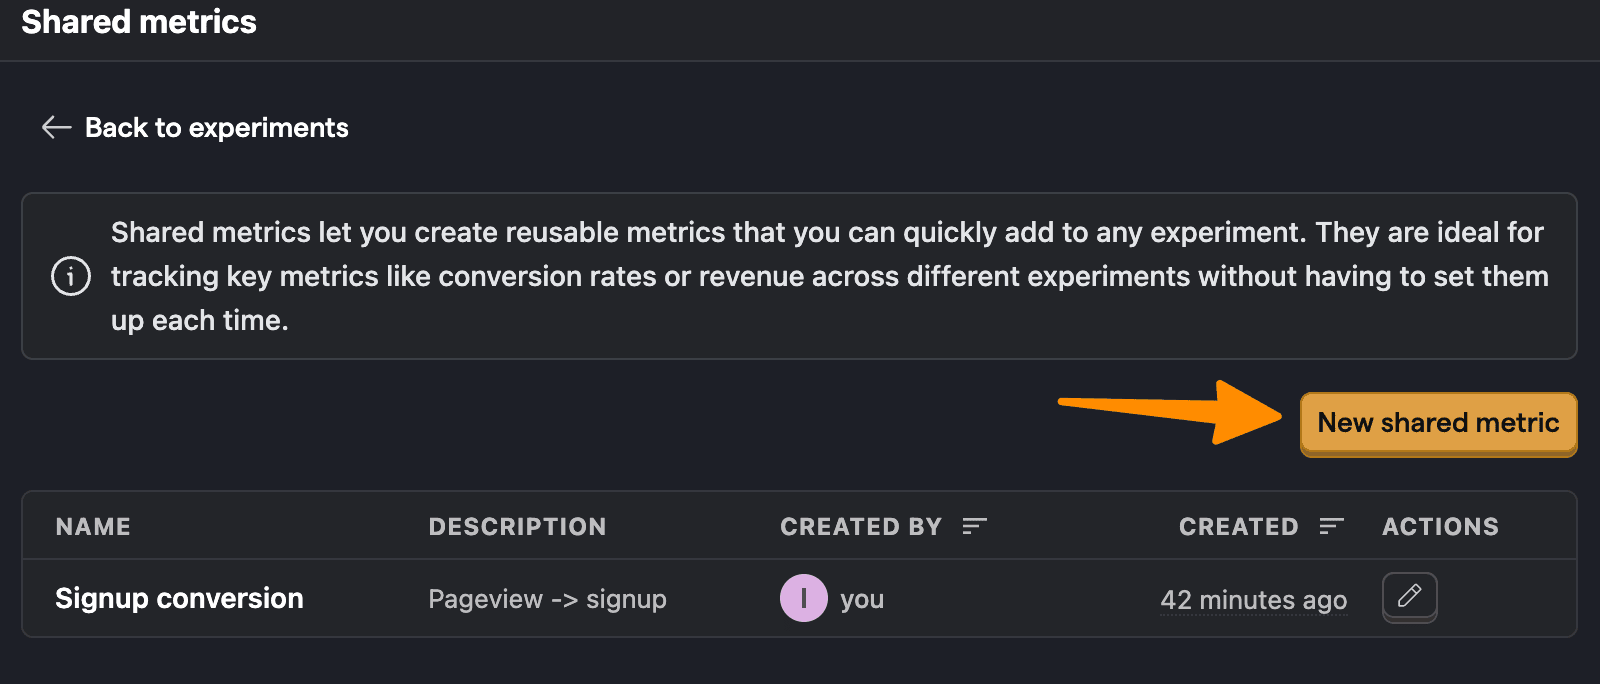
To create one, go to the shared metrics tab and click New shared metric. From here, they are created the same way as single-use metrics.
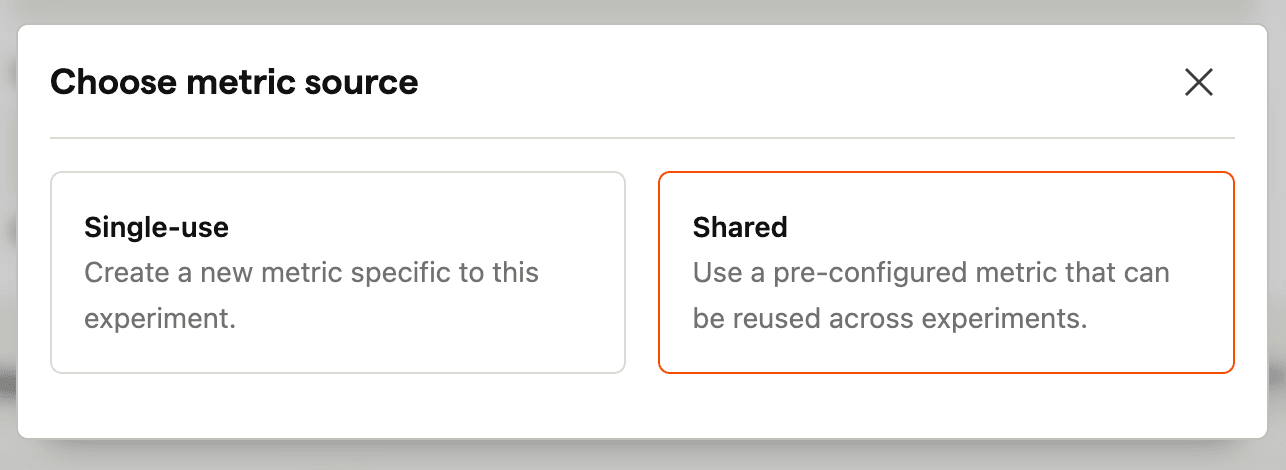
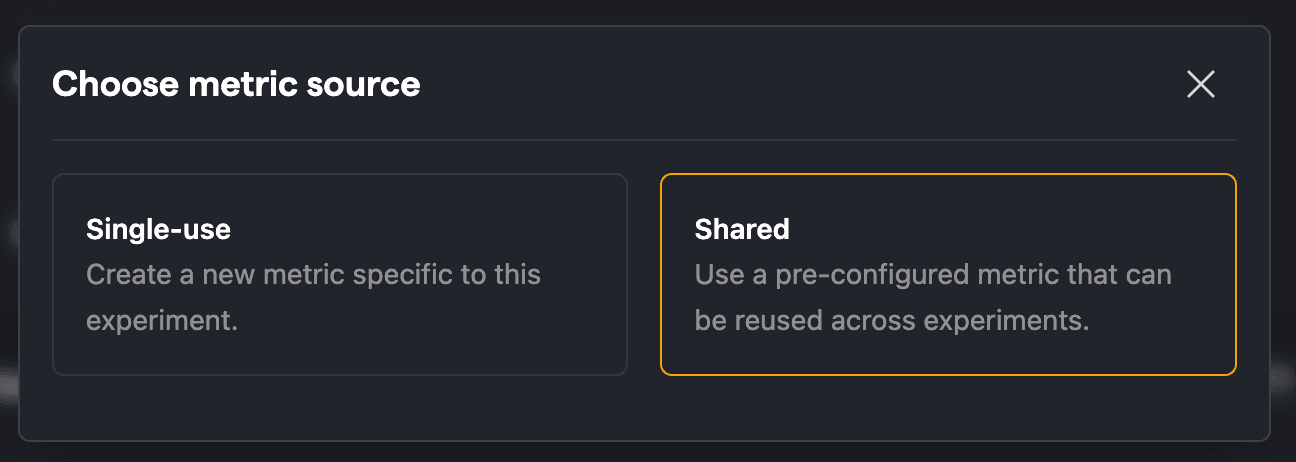
Once created, choose Shared as a metric source when adding a primary or secondary metric to an experiment and then select the shared metric(s) you want to use.
